It's hard to believe it's already been a year since this incredible event. The pace of life has certainly changed. In the years, months, and especially days leading up to the eclipse, there was such a sense of urgency. So much to do to get ready and always the nagging feeling that something was being left undone, the worry if everything would go as planned, if the weather would cooperate. In some ways, it's a nice break to not live with that constant anticipation, but I would happily live with that again to be able to see another total eclipse! It's not all behind us, though. The journey continues as we process and learn from this astronomical marvel.
Although I spent untold hours post-processing images of totality, I continue to run across information and examples of pulling out even more detail through advanced processing techniques. For example, although French optical engineer and amateur photographer Nicolas Lefaudeux doesn't publish his techniques, his images are great inspiration to delve even deeper into the science and art of eclipse image processing. I continue to experiment with new techniques on my own images so perhaps may have new versions to share some day.
On the science front, one of the activities I am the most proud of is having participated in the NASA-funded 2024 Eclipse Megamovie project. As with the 2017 project, the goal is to use images taken throughout totality, all along the eclipse track, to create a unique time lapse view of the Sun's corona - something we can only view from Earth during a total solar eclipse - to study its behavior. Unlike the 2017 eclipse where I got clouded out, this time I was able to capture all the images needed for the project.
While the eclipse just lasted a few hours, the scientific analysis using the images and data collected that day will go on for years! You can read the one year anniversary update from principal investigator Dr. Laura Peticolas for more information on progress to date and what's still to come.
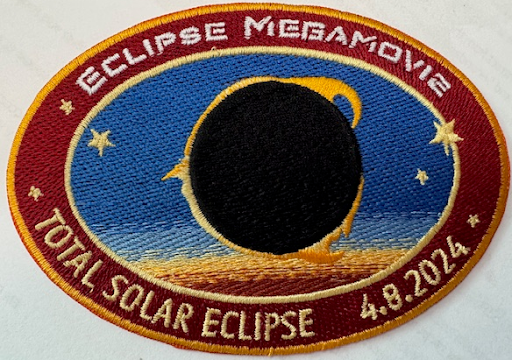
To mark the anniversary of the eclipse, the project sent each of the volunteers our own mission patch! Be sure to read the backstory of NASA mission patches and the EM2024 mission patch. We were also each recognized with credit for our contributions to the project on the Eclipse Megamovie web site. It's pretty cool to see my name on the list!
To revisit my stories from preparing for and experiencing the April 8, 2024 total solar eclipse, see the link under Quick Links in the sidebar.
Below I've included a gallery of some of the highlights of my eclipse experience.
Capturing fine detail in the corona and the lunar surface illuminated by Earthshine
Baily's Beads and Solar Prominences
Time lapse of totality
Lunar umbra (shadow) passing over landscape captured from drone
As described in my last post, I was inspired by an APOD entry last December featuring a solar analemma captured by a security camera on someone's driveway to create my own timelapse video tracing the path of the Sun over a year, capturing the distinctive figure eight shape of the analemma as the shadow moves day by day. This project recreates a technique used for timekeeping, calendar making, and as the basis for religious and cultural rituals going back thousands of years. But as with the APOD that inspired it, I'm putting a modern spin on this ancient concept by leveraging programming, computers, digital cameras, photo and video editing software, design software, and 3D printing. In this post, I'll provide an overview of my setup, including how I planned out the project, created a custom gnomon (the part of a solar timepiece that casts the shadow), set up the camera and automation system, and the initial image processing and results.
Decision #1: What to Shoot With
Blink camera
First off, I had to pick a camera to capture each image with. As the subject is outdoors - and the project lasts for a year - using a DSLR like my Nikon D750 wouldn't be feasible. I could easily dedicate one of the IP cameras I have for a year but they aren't weather-proof and they have to be plugged in. Luckily, we have a set of Blink outdoor cameras around the house. They are weather-proof, battery-powered and can be accessed over a network connection. The only concern I had with them is the mount is easy to move which could interfere with having the same point of view for every image over the course of the year. I solved that by 3D printing a new mount that I could lock in place with a set screw.
Decision #2: Where to Shoot
My first thought was to do something like in the referenced APOD... shoot to the north with the shadow to track being cast in front of the camera with the Sun shining from behind. I even considered mounting the camera so that its own shadow would be what traces out the analemma. However, while our house faces north-northeast, we have 6 huge cedar elm trees out front; during the summer any shadow cast from the edge of the house would be lost in the shade of the trees. Given that, I settled on shooting in the back yard.
Decision #3: When to Shoot
View to be captured
The decision of when to shoot and where to shoot go hand-in-hand. Deciding to shoot in the back yard was fine but incomplete till I figured out what time of day to shoot. Long story short, as we already have a Blink camera on our side fence, I figured out that as that fence runs on a line that's about 153 degrees (approximately south-southeast), I could shoot at just after noon each day and the shadow would trace out the figure eight of an analemma on the ground just on our side of the fence and in the field of view of that camera.
Decision #4: What to Shoot
Gnomon on fence
Although I could have mounted just anything on top of the fence to cast a shadow, I took advantage to having access to a 3D printer and designed and printed my own gnomon in the form of a stylized Sun mounted on a post. It was printed in black but I took yellow Plasti-Dip both for a "sunny" look and also to give it a bit of additional protection against the elements.
Decision #5: How to Shoot
Early photographic attempts to capture a solar analemma in the sky with a film camera required incredible dedication, shooting at the exact same time of day, one day a week or every few weeks for an entire year. Because I am creating a timelapse video rather than a composite photo, I need to capture an image more frequently (every day) so I decided to automate the process. I have a home automation solution called Home Assistant. With it, I was able to write a script that takes a photo with the Blink camera in the back yard at 12:30pm (1:30pm during Daylight Saving Time) every day. The system also records metadata about weather conditions (overcast, sunny, etc.) in a text file, storing both the images and data on a home computer for later use in assembling the video.
Progress To-date
Although I only recently began posting about this project, I started planning it in December and started shooting the day after the winter solstice which fell on December 21st. Things are going well but there have been a few bumps in the road:
It turned out that the shadow cast by the first gnomon I created was a little too small so I redesigned a larger version and replaced the first one with it at the end of December.
Although the camera mount is locked in place, it appears that the image framing shifts a very small amount over the course of several days. My guess is that the weather going from sub-freezing to springtime temperatures, the plastic mount is expanding and contracting, affecting the alignment of the camera. Thankfully, the difference from image to image is small enough that I can align all the images using Photoshop so that they don't shift from day to day.
Early on, rain left water drops on the camera lens that affected the images but we've had quite a bit of rain since then and it hasn't happened again. If it does, I may need to add a hood to the camera mount.
In spite of these issues, my first pass at assembling the images into timelapse format looks promising. This version has two sections. In the first, watch for the yellow dot on the ground... it overlays the gnomon's shadow. In the second section, watch that same area of the ground and you'll see the shadow of the gnomon trace out the beginning of an analemma.
Timelapse showing 6 weeks of daily shadow captures (with gnomon shadow highlighted and with raw video)
As you can see, at just 6 weeks, there is not enough of the analemma yet to make out its distinctive figure eight shape but a pattern is beginning to take form. And there are some oddities in the video - gaps from overcast days (and some rain) and other things moving besides the shadow cast by the fence and gnomon (leaves, chairs, our dog, etc.) - all things I expected given my past experience creating timelapse videos.
But how exactly did I create the gnomon? What tools did I use to automate the daily image capture? And what techniques am I using to process and align the images? To create the video? In my next post, I'll dive into these technical details and more, sharing the nuts and bolts of my analemma timelapse setup for those who want to explore further.
Update: One Year Later
Having had an issue with the video camera a month or so after this post was originally made, I've postponed wrapping up the project, intending to have the final video run from the June solstice of 2025 through the June solstice of 2026. Stay tuned!
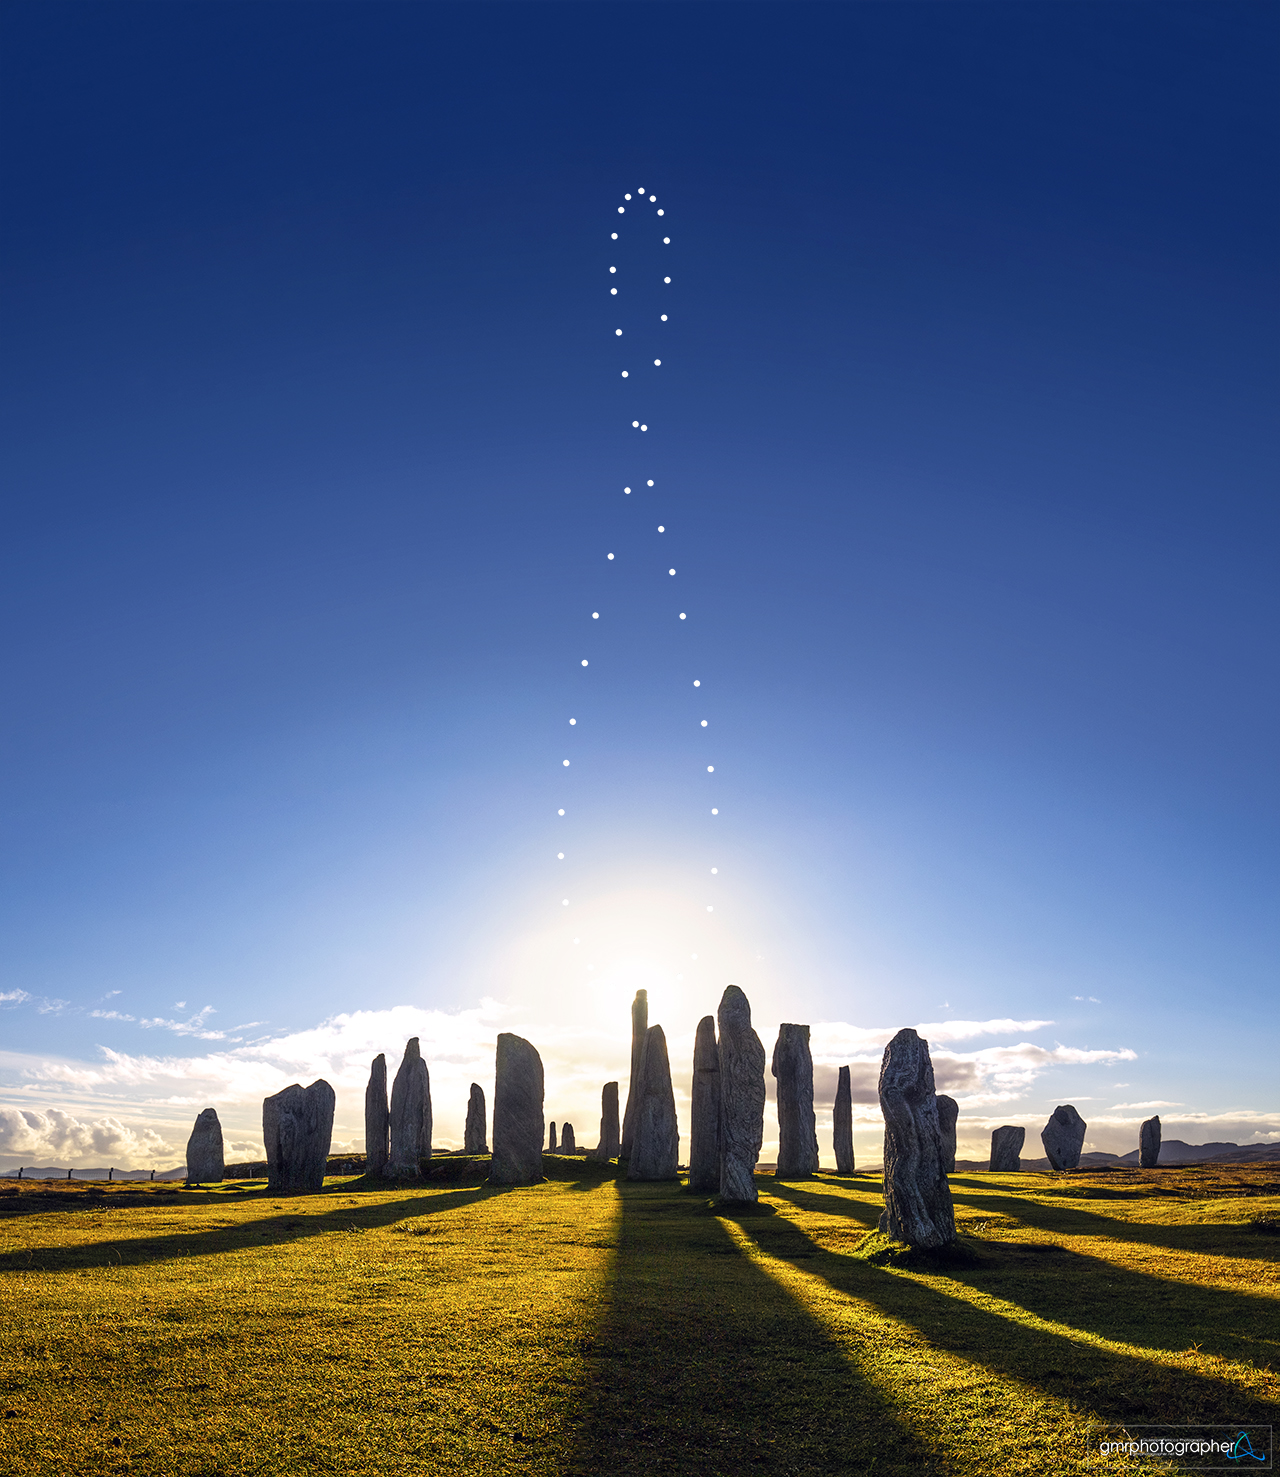
If you follow the Astronomy Picture of the Day (APOD) like I do, you may have seen the December 2024 entry showcasing a photographer in Colorado who used a security camera to track a shadow on their driveway at the same time each day for nearly a year. As the seasons changed, this shadow traced out a distinctive figure-eight pattern known as an analemma. I found the simplicity and ingenuity of using readily available technology to capture such a complex phenomenon fascinating.
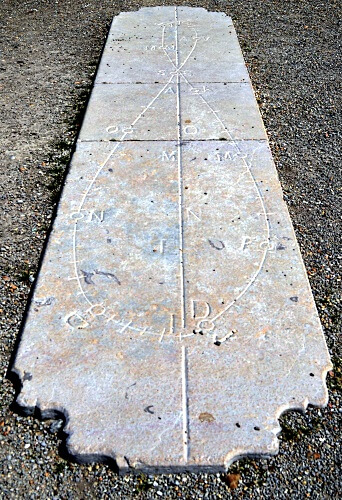
What caught my attention wasn't just the clever use of a security camera to track the sun's movement, but how it connected ancient and modern ways of marking time. Most of us have seen sundials in gardens or parks, where shadows mark the time of day. Fewer people are aware of solar calendars, like the Noon Mark on the south face of the Royal Observatory in Greenwich, which uses carefully placed markers to track a shadow's position at noon throughout the year, forming the same figure-eight analemma shape. In the video above, here was someone using modern technology to capture the same astronomical pattern that astronomers and timekeepers have been tracking for centuries.
Inspired by this APOD, I decided to capture a shadow analemma using technology myself. I'll dive into the details of that in my next post, but first, I’d like to share a bit of historical and scientific context.
The word analemma comes from ancient Greece, where it originally referred not to the figure-eight pattern itself but to the mathematical techniques used for calculating the Sun’s position in the sky. It was derived from the Greek word analēmma, which referred to the support or pedestal of a sundial. In astronomical terms, however, analēmma described the methods used to account for the variations in the Sun's apparent motion throughout the year. This early use of the term was central to creating accurate solar calendars and tracking celestial events.
In modern usage, analemma now refers to the distinctive figure-eight pattern traced by the Sun's position in the sky when observed at the same time each day throughout the year. This pattern arises from two astronomical phenomena: the tilt of the Earth's axis and its elliptical orbit around the Sun.
The Earth's axial tilt of 23.5 degrees is the easy part of the pattern to understand. Because of this tilt, the Sun appears lower in the sky during winter and higher during summer in the Northern Hemisphere, with the opposite occurring in the Southern Hemisphere. If this were the only factor, the analemma would form a vertical line rather than a figure-eight, as the Sun's position in the sky would rise daily between the winter and summer solstices and descend daily between summer and winter.
However, because the Earth's orbit around the Sun is an ellipse, it is closer to the Sun around January and farther from the Sun around July. According to Kepler's Second Law, an orbiting body moves faster as it is getting closer to the body it orbits and slower as it is moving farther away. When the Earth is speeding up, the Sun appears a little ahead of its average position in the sky (i.e., where it would be if Earth's orbit were a perfect circle) and, as it is slowing down, it appears a little behind its average position. This, combined with the Sun's changing elevation through the seasons, creates the figure-eight pattern.
Long before cameras could record the Sun's position in the sky, ancient civilizations from Egypt to China used a down-to-earth approach to track time: observing shadows cast by the Sun—patterns that, over time, reflected the effects of the analemma. They built elaborate structures specifically designed to mark the passage of days and seasons by the position of shadows. These structures were not just timekeeping tools; they were woven into religious and cultural traditions, guiding agricultural cycles and celebrations.
In the modern era, photographers have found a new way to capture the Sun's path: sky analemmas. By mounting a camera in a fixed position and taking photographs of the Sun at precisely the same time each day throughout the year, they create composite images showing the Sun's position tracing a distinctive figure-eight pattern across the sky. These images have become iconic astronomical artworks, requiring dedication and precise timing to create. However, they offer a more abstract way to visualize the Sun's movement—one made possible by photographic technology.
Shadow analemmas are particularly intriguing because they translate this celestial pattern into something tangible. While sky analemmas show where the Sun is, shadow analemmas reveal the effect of the Sun's position on our immediate environment. By following the Sun's path through the shadows it casts on familiar surfaces, we can experience the same astronomical phenomena that guided ancient timekeeping. Shadow analemmas can bridge historical traditions and modern science.
In this project, I seek to unite ancient astronomical practices with modern technology by developing an automated system to capture a year-long shadow analemma. Throughout this series, I'll explore the technical details of my setup, the challenges I've encountered, and the insights I've gained. Join me on this journey to explore the intersection of astronomy, photography, and the rhythms of everyday life.
If you read my previous post on the RadioLab / IAU story of quasi-moon named Zoozve and the contest to name another quasi-moon, you may be happy to hear that the finalists have been selected and it is time to vote!
Although I thought my submission, Zephyrus, was a great name for a quasi-moon, unfortunately the panel reviewing the submissions didn't select it. But given they had over 2,700 entries to pick from, I guess my odds were pretty long anyway. 😲
Here are the names they selected as finalists:
Bakunawa - a mythical dragon from Philippine folklore
Cardea - the Roman goddess of doorways and transitions
Ehaema - the "Mother Twilight" from Estonian lore
Enkidu - the wild and noble companion from the ancient Sumerian Epic of Gilgamesh
Ótr - a shape-shifting dwarf from Norse mythology
Tarriaksuk - shadow beings of Inuit legend that mirror human forms yet dwell in another dimension
Tecciztecatl - an Aztec lunar god who once aspired to be the sun
Care to join me in voting for one of these 7 to be selected as the formal name of quasi-moon currently known as (164207) 2004 GU9? We have until January 1st, 2025. You can cast your vote here!
A friend, Michael, recently shared a post on Facebook from the account History pictures about drafting in the pre-CAD days. It brought back a rush of memories I hadn’t revisited in years. They were fond memories so I thought I would share it here along with some thoughts for the future.
From Square One
Michael was sharing the post because it brought back memories for him of taking drafting in 7th grade. Like Michael, my journey with technical drawing started in school. I took a semester of Drafting in my senior year. Not only did I enjoy the class, but it created a new connection with my Dad.
Although his job as a telephone switching office manager didn't involve drafting, he had taken classes at technical school that involved creating electrical diagrams. He passed down his drafting square and mechanical pencils to me - and I still have that square today!
After high school and a year of college, I joined the U.S. Navy, though that's a story for another time. After the Navy, I had dreams of becoming an architect. While full-time college wasn't financially feasible, and pursuing an architecture degree part-time wasn't practical, I found a middle ground after we returned to Texas: going back to Eastfield College. Taking evening classes while working during the day, I pursued an Associate Degree in Drafting & Design. Here are some examples of some of my schoolwork.
At Eastfield, I did a good bit of hand drafting but I also studied computer aided drafting and design (CADD) systems. Eastfield had a ComputerVision system called CADDS that was my first experience with drafting with computers and only the second time I had worked with a computer (the first being a semester-long introductory class in high school). CADDS was a complex beast with a steep learning curve, at least for someone new to the technology. Our teacher had war stories of working on the prior generations of CADD systems where he had to create designs using punch cards. I'm glad that was before my time!
What was new and upcoming, though? AutoCAD. Eastfield had set up a small lab with a handful of PCs running MS-DOS and AutoCAD. It was an exciting advancement, even in its early versions. AutoCAD is what really got me excited about CADD. I left drafting and CADD behind professionally almost 35 years ago, but these days I still use AutoDesk software: I've created or modified several designs using the free version of Fusion 360 for objects to create with a 3D printer.
Early version of AutoCAD
Current version of Fusion 360
Breaking New Ground
My degree gave me the foundation I needed to start working in CADD professionally, and one remarkable connection opened the right door. Thanks to Mom's close friend Virginia Helton, PE, I landed a position at the Texas Department of Highways and Public Transportation (now TxDOT) as a CADD technician. Virginia's story was pioneering – when she received her engineering license, she was one of only three women among 700 civil engineers in Texas. By the time I joined the Highway Department, the gender balance was slowly improving but still had a long way to go. Although I never worked directly with Virginia, her role in launching my CADD career gave me a deep appreciation for those who break barriers and help others follow.
Once I joined the Highway Department, I felt like I had joined the big leagues. They used CADD systems from Intergraph. From its early days creating software for missile guidance systems for NASA, Intergraph had grown to a major provider of CADD hardware and software. The Texas Highway Department was an early adopter of Intergraph CADD workstations due to the company's advances in mapping technology, a key function for civil engineering.
The Intergraph workstation I used was large, with two monitors, a large digitizing table, a puck (like a wheel-less mouse) and a keyboard. It ran software called Interactive Graphics and Design System (IGDS). Under the monitors was a large cabinet that had the local computing hardware. The workstation was connected to a Digital Equipment Corporation (DEC) VAX 11/785 minicomputer located in the regional data center across the parking lot.
Projects That Left Their Mark
In some cases I was taking working notes from an engineer and creating a set of engineering drawings (eventually to be printed as blueprints) and in other cases I was taking older, hand-drawn designs and copying them into the computer to be referenced or updated (essentially, laying them out on the digitizing table and tracing them with the CADD system). I don't recall everything I worked on - some were small projects and some were large - but a few stuck with me.
Have you ever driven under SH114 on O'Connor Blvd in Los Colinas? I drew the civil engineering designs for the update done to that interchange in the mid-80s.
Remember what Central Expressway was like before the major expansion in the 90s? Much of the actual engineering work on that project was subcontracted out to commercial engineering firms but the right of way maps, the plans that showed where we could build, were done by the Highway Department. Towards the end of my 5 years with the Highway Department, I'd moved to the Right of Way Division. Although the engineer who brought me over did so because of my growing reputation for having (self-taught) programming skills, I still had drafting duties, one of which involved working on the new right of way maps for the Central Expressway.
Back to the Drawing Board
While my day job at the Highway Department involved computer-aided design, my drafting pencils weren't gathering dust. I landed an interesting freelance opportunity that would put my hand-drafting skills to work. The project involved creating architectural design drawings for a large house in Garland - one with its own interesting story. The original owner, a guy I was told had a string of dry cleaning businesses and a large family, had commissioned the house but then ended up going into bankruptcy. The bank took possession of the house and hired a general contractor to finish it and get it sold.
A lifelong friend Neil Kirkpatrick, who had the contract to build the backyard fences, referred me to the general contractor who wanted to use architectural sketches instead of photos in the marketing materials. I visited the house several times and worked with the original blueprints and my site notes to create the drawings. At the time, I was a little frustrated that they wanted everything done by hand instead of using CADD but looking back it was a long, hard project that was very rewarding (at least in terms of personal satisfaction - I don't recall what I got paid but it wasn't all that much).
Sketching the Future
A lot has changed in the last 40 years. My journey from mechanical pencils to massive CADD workstations to lightweight design software like Fusion 360 mirrors the broader evolution of technical drawing. But even those advances seem incremental compared to what's happening now – consider the image at the top of this blog, which wasn't drawn by hand or even designed with software, but generated by AI. While we can't yet speak designs into existence through CADD systems, that future feels surprisingly close.
Is that a bad thing? I'll leave each of you to decide that for yourselves. But after four decades in technology, including my transition from drafter to programmer to architect, I can offer two perspectives.
First, my transition from CADD technician to programmer was driven by a realization: as much as I enjoyed the creative outlet of drafting, I was beginning to feel like I was just translating others' ideas rather than creating my own. I wanted to be the person responsible for the real innovation, which led me to software development and technology architecture. Had I not aspired to move into a creator role, technological evolution might have eventually eliminated my position entirely, as happened to many who were content in their existing roles. This mirrors a larger shift we've seen - just as word processing eventually led to business people writing their own materials instead of dictating to secretaries, computer aided design has evolved to where engineers can directly translate their vision into reality.
Second, I recall what a senior engineer at the Highway Department told me about CADD adoption. He noted that while computers didn't necessarily help them create better engineering drawings than by hand, they could iterate designs so quickly that in the time it previously took to do a hand-drawn version, they could refine a design multiple times - resulting in more efficient, safer, and more cost-effective solutions.
These transformative forces - the democratization of tools and the acceleration of iteration - are now being amplified by AI in ways we're just beginning to understand. The AI image in the header of this blog hints at what's coming. While we might not yet fully design via conversation, it may be just around the corner. And when it arrives, instead of replacing creativity it will hopefully remove barriers between imagination and implementation, just as past advances have done.
Postscripts
For those of you who aren't familiar with computer-aided graphics, you may be wondering "what's CAD vs. CADD"? Computer Aided Design (CAD) is a more generalized term for the technology and function. Computer Aided Drafting and Design (CADD) really harkens back to the days I've discussed above when draftsmen (and women) transcribed the work of an engineer into drawings.
For those of you who are fans of the British comedy from the 70s, Monty Python's Flying Circus, you will have caught that besides the title of this post highlighting it is a departure from the topics I usually cover here, it is also the catch phrase from this classic show. To close out, here is the trailer from the film of the same title.
If you've taken a photo of the night sky, whether with a camera or your phone, you may find it contains a few unexpected streaks. Think you captured a meteor? Or that comet you've read about in the news lately? While it could be one of those, it might also be something else.
People post questions about this so often in places like Facebook that I wrote about it last year. Now, I'm posting an update, focusing on how to quickly identify what you've captured; the details of why are in the earlier post.
Length?
First, how long was your exposure? If it was just a few seconds or even a fraction of a second, any streak will be relatively short, and its length may not be much help in identifying what caused it. However, if it was a long exposure—5 seconds, 10, or even longer—a short streak may be a meteor as they only last a fraction of a second, but a long streak is more likely an airplane or a satellite.
Dots?
Next, is the streak solid, or is it a line with dots? If there are dots, it is most likely an airplane. If there are multiple parallel lines with dots, the aircraft is flying at a relatively low altitude.
Shape?
No dots? What do the ends look like? If both ends are blunt, then what you've captured is most likely a satellite. Larger satellites (like the ISS) will leave a thicker trail. If only one end is blunt but the other is tapered, or both ends are tapered, you might have caught a satellite passing in or out of Earth's shadow, fading into or out of view.
Meteors generally also have tapered ends though usually starting very thin, getting gradually thicker and then quickly coming to a point at the end of its journey.
Frames?
If you took multiple, successive photos and the streak only appears in one frame, that's another sign it is probably a meteor. If it shows up in more than one image, then it's either an airplane (any dots?) or it is a satellite.
Color?
If the streak has noticeable color, especially different colors along its length, then it is probably a meteor. With aircraft there may be colors but the streaks are a constant color and the dots generally differ in color from the streaks. With satellites, there's usually no discernible color as they just reflect sunlight.
Fuzzy?
What if the streak is not so much a line as something cloudy with a bright spot at the lower end? Then maybe you did capture that comet!
Although it may seem from most of my posts that this blog is all about astronomy, sailing is also one of my passions so it's time to talk about that for a change.
Saturday was the start of the latest round of the America's Cup, the longest running sporting event in the world. It's always been a rich man's sport, seeing who can build the biggest, fastest boat. The defender this time is Emirates Team New Zealand and they are battling the challenger, Ineos Britannia who beat out 4 other teams (including American Magic) for the privilege. Although the regatta is usually sailed on home waters of the defender, for 2024 New Zealand opted to have the racing held in Barcelona, Spain.
This time, the "biggest, fastest boats" are the AC75, a 75 foot long foiling sailboat built to sail up to 50 knots (58mph). Actual speeds have been clocked at 55.5 knots (63.9mph)! They have crews of 8 and that includes 4 "cyclors", guys pedaling on equipment like a stationary bike to provide all the power required to operate the boat.
Starting in the 2013 edition (raced on San Francisco Bay with AC72s, wind-sailed foiling catamarans), the America's Cup introduced cutting-edge technology originally developed for football broadcasts. Using special cameras with precision positioning, they can now digitally draw the race course on screen. Remember the first time you watched a football game and noticed the down line seemingly painted on the field, yet players could walk in front of it? Since 2013, this same tech has been applied to the America's Cup, growing more sophisticated with each edition.
Watch this 1 minute clip from the Louis Vuitton challenger series, featuring Great Britain racing against Italy whom they later defeated for the right to face New Zealand. It showcases what makes the America's Cup so captivating: the speed and size of the boats, the mind-boggling sight of sailboats flying across water at near-freeway speeds, the intense competition and tactics, and even the digital augmentation. The latter is used to illustrate how the wind coming off the sails of the lead boat creates "disturbed air," which the tailing boat tacks (turns) to avoid.
While this is worlds apart from the typical sailing we do on Dallas lakes, the America's Cup has long held a fascination for me!
Comet C/2023 A3 Tsuchinshan-ATLAS, having swung around the sun and headed to the outer reaches of the solar system, is now climbing higher in our evening sky each night. Today marks its closest approach to Earth, so I went out to capture it.
I took this shot from the east shore of White Rock Lake, with the old Pump Station and its distinctive smokestack in view. Despite A3's brightness, it's a challenge to spot in urban areas without optical aids. Even with my Nikon D750, while the coma is easily visible, the tail remains quite faint.
Over the next week, the comet will rise higher above the horizon's haze, improving visibility. However, it's a double-edged sword - as it climbs, it will also retreat from Earth, gradually dimming until it's only visible through a telescope.
I'm planning another attempt in a few days, hoping to capture a better shot of that elusive tail. If you're interested in catching a glimpse of this cosmic visitor, find a spot with a clear western horizon in the hour after sunset between now and the end of the month. It's worth the effort!
Want a Zoozve Poster? Click on the image to buy one from Alex
What's a Quasi-moon
Right? What the heck are they? A quasi-moon of a planet is an asteroid that remains in the general vicinity of its planet. Unlike a moon, a quasi-moon doesn't orbit the planet itself but orbits the Sun, just with a path similar to that of the planet. If you want to learn more about quasi-moons, check out the Wikipedia quasi-satellite article.
BTW, if you have seen the latest news reports about Earth having a mini-moon for two months as asteroid 2024 PT5 is captured by Earth's gravity, you might wonder about the difference between a mini-moon and a quasi-moon. See the Wikipedia quasi-satellite and temporary satellite articles for the details but basically quasi-moons have a (mostly) stable orbit and mini-moons don't.
The Zoozve Story
I first learned about quasi-moons listening to a viral podcast episode about something called Zoozve. You should check out the Zoozve episode yourself, both for the full story and more details on this unique object, but the gist of it is that the co-host of Radiolab, Latif Nasser, was looking over a solar system poster bought for his son and noticed the name Zoozve, shown as a moon of Venus. Having never heard that Venus has a moon, he did his thing as an investigative reporter and learned that it was a quasi-moon. He also discovered that Alex Foster, the graphic artist who created the poster, had mistakenly shown the object's provisional designation, 2002VE (technically, 2002 VE68) on the poster as ZOOZVE. Latif eventually pitched the idea of submitting the name Zoozve as the official name of 2002 VE68 to Brian Skiff, the scientist who had discovered it. Brian submitted the name to the International Astronomical Union (IAU), the scientific body responsible for governing the names of astronomical objects, and it was eventually approved.
The Naming Contest
Orbital path for 2004 GU9 Click to enlarge
Inspired by the naming of Zoozve, Radiolab and the IAU kicked off a contest this past May to name one of Earth's quasi-moons, the asteroid 164207 (2004 GU9), as a way for the public to learn more about quasi-moons and the ways in which the naming process connects culture and science. You can read more about the contest here. There aren't many quasi-moons and only a few have official names, the rest just have a provisional designation, so it is pretty cool for the public to have an opportunity to suggest the name for one.
The deadline for submissions is today so if you weren't already aware of the contest, there are only hours left if you want to make a submission. However, you can still participate as Radiolab and IAU will pick 10 finalists in October and then during November and December the public will be able to vote on which of these they think will be the best name for 2004 GU9. The winning name will be announced in January, 2025.
Getting Involved
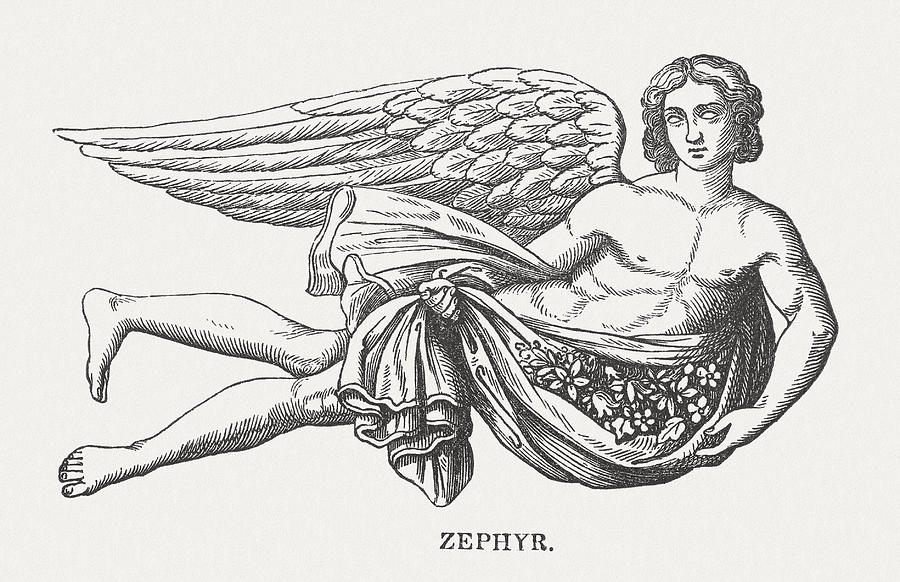
As an amateur astronomer and STEAM advocate, the opportunity to be involved in naming an astronomical object really intrigued me. I've spent time off and on over the past few months working on this. First I had to come up with a name. It had to be from a mythological source (excluding types of names used for things like planets) and it couldn't have already been used as the name of another celestial object. The name I selected is Zephyrus.
After coming up with the name, I had to draft a citation, the official description that will be recorded with the name, and a justification, my case for why they should choose my submission. Drafting those involved numerous rewrites. In the course of this I did leverage some online resources, even using AI for idea generation and suggestions on improving the writing, but ultimately the end result is my own work. See below for what I submitted.
Name:
Zephyrus
Source:
Greek Mythology
Citation:
Zephyrus is the Greek god of the west wind, one of the four Anemoi, the wind gods. He symbolizes renewal, life, and the gentle forces of nature. This name was selected through a contest organized by the IAU and Radiolab to name a quasi-moon of Earth.
Rationale:
Zephyrus, one of the four Anemoi of Greek mythology, was the god of the West wind. Although generally associated with gentle breezes, Zephyrus also had a wilder side, sometimes referred to as stormy or ill-tempered. This dual nature, a balance between gentle influence and untamed power, is also reflected in the unique orbital properties of quasi-moon 2004 GU9. Its orbital path has a subtle grace and beauty yet represents possible danger, reflected in its classification as a Potentially Hazardous Asteroid.
2004 GU9 is held in its orbit by the Sun, echoing Zephyrus' struggle with Apollo, the Sun god. Both the wind god and the asteroid have been subject to the pull of a more powerful force. Just as Apollo won the affections of Spartan prince Hyacinthus over Zephyrus, the Sun dominates the movements of 2004 GU9. These parallels illustrate a delicate balance between autonomy and influence, where smaller entities make their way under the sway of greater powers. Both cases reflect struggle and equilibrium.
Choosing the name Zephyrus for quasi-moon 2004 GU9 would pay tribute to the complexity and balance of Earth’s winds and of the movements of cosmic bodies. It would also honor the imaginative spirit of this naming contest. Just as the naming of quasi-moon Zoozve was the result of a creative spark flowing from discovery, Zephyrus is often associated with spring and growth, with the creation of the new.
If you're interested in learning more about Zephyrus, you can check out the Olympioi or Wikipedia articles on him for additional information.
Hopefully, my submission is selected as one of the finalists. If it does, I'll do a follow-up post with information on how to vote. I hope you'll consider voting for Zephyrus!
Whether or not Zephyrus ends up being chosen, it's exciting to be part of this naming process.
I'd love to hear if you have an idea for a name for 2004 GU9, have feedback on Zephyrus as a name for it, if you have questions or comments on quasi-moons or if you have questions about how and why astronomical objects are named. Drop a note in the comments - let's chat!
On a recent trip to Vancouver Island, staying on the coast of the Georgia Strait in Union Bay, we had a few days of crystal clear weather. On one of those nights I decided to try taking a star trail shot. Rather than taking one long exposure (as with film), my plan was to shoot multiple short exposures and merge them in post processing. Although the sky over the Georgia Strait is relatively dark (Bortle Scale 3), the Moon was nearly full so I followed the techniques outlined in this article about shooting star trails in light polluted skies.
I set up my Nikon D750 and Irix 15mm lens in the backyard of our Airbnb, did some test shots, started the camera intervalometer and went to bed. About 6:30 in the morning, the sunlight streaming into the bedroom woke me and I decided to bring the camera inside before going back to bed. I was a little surprised the camera was still shooting as I'd started it before midnight and had assumed the battery would have died after 4 or 5 hours.
When I took a look at the images captured that night, naturally the ones towards the end were all over-exposed; sunrise had been at 5:12AM. However, I also noticed that the sky never really got fully dark in any of the images. Consulting PhotoPills, it turns out that astronomical twilight that evening was from 11:18PM through 12:01AM and astronomical twilight the next morning was from 11:59PM the previous evening through 3:25AM. In other words, there was never a time when it was truly night (the time between twilights). Being located at almost 50 degrees north latitude and as it was a day before the summer solstice, summer nights there are really short!
This image is my first pass at post-processing and only covers about an hour and 45 minutes. Even still, it took about 4 hours of work to go through the images removing light trails from airplanes and satellites. I have more images to process, at least through 3:25AM (the start of nautical twilight) but besides having a higher number of airplane and satellite trails to edit out, those images also have a lot of ferry traffic on the strait, leaving long bright streaks of light along the waterline. I'll eventually work on those but for now I'm satisfied with what I have done so far.
As you can see, shooting directly out over the strait involved having the camera aimed just a little east of due north. The small arc in the center of all the other concentric arcs is the star Polaris, the North Star. The brighter star trails around it are from stars in constellations like Cassiopeia, Cepheus, Perseus and Cygnus. If you look closely, you'll see some color variations; not all the stars are white.
One light streak I left in that isn't a star trail is on the far right. Blogger doesn't provide a way for you to zoom in but if you could you'd see a small meteor, a shooting star.
Enjoy! Be sure to click on the image to see enlarged.
Update: I've replaced the original image with a revised edit in which I blended a single foreground image for a more natural appearance.
Some news headlines leading up to the total solar eclipse last week suggested we might be able to see the "Devil Comet" (12P/Pons-Brooks) during totality, though with binoculars or a telescope, not naked-eye. We didn't see it but then we even forgot to use our binoculars to look at the eclipsed sun during totality much less remembered to use them to look for the comet.
I was asked whether the comet might appear in the photos I was taking with my telescope and my answer was, unfortunately no, it was well outside the field of view of my equipment.
However, I was excited to see an article in my news feed late last night describing a comet passing close enough to the sun to fit in a telescopic field of view. Called SOHO-5008, it was a sungrazer, a comet passing so close to the Sun it would appear in coronagraph images by the SOHO solar satellite. This one had been identified in SOHO images the morning of the eclipse and several people found that they had captured it in their eclipse images. Later that day, it had burned up in the Sun.
This morning, I pulled up my own images from totality and found that I had captured it, too! It took bumping up the exposure far more than I usually would but, once I did that and made a few other adjustments to bring out more detail, there it was. Here is an edit with labels similar to an image from my last post, noting some of the brighter stars visible from constellation Pisces and adding an enlarged inset for the comet.
I may do another edit later on to balance out the overall image but i wanted to go ahead and share this now.
I went down a bit of a rabbit hole this week, assuming that to really get sharp detailed images of totality I needed to go through the rather involved process of using calibration frames to process all of the images I planned to stack before trying to stack, register and merge them. After spending a few evenings starting down that road, I took a break and in reviewing tutorials on processing solar eclipse images I ran across several that describe doing everything directly in Photoshop without the use of registration frames.
Following the process described in this Sky & Telescope article, I created the image above using a set of images shot at 2 stop intervals from 1/4000th of a second to 1 second, all shot at f/5 and ISO 100 with my Nikon D750 through our Sky Watcher Evostar 72ED telescope.
Click on it to enlarge and check out the incredible detail. You'll find features like:
Plenty of detail in the solar corona
Solar prominences
The lunar surface illuminated with light reflected from Earth (Earthshine)
Several stars from the constellation Pisces
This is just the first phase of edits described in the article so more to come. In the meantime, I did a separate version with features labeled.
As described in a previous post, I assembled a Sun Funnel to use on our Parks 60mm refractor with the tracking motor running to keep the Sun in the field of view as it across the sky during the April 8th total solar eclipse.
Our family members who gathered to watch the eclipse enjoyed having an alternative to staring at the Sun through eclipse glasses. It worked great!
In this clip, you can see the partially eclipsed Sun, a sunspot and even clouds drifting by.
One of my primary goals for this total solar eclipse was to capture a variety of telescopic views of the eclipse. The similar goal I had in 2017 was spoiled by overcast skies that resulted in a mad dash down the road with Beau Hartwig chasing clear skies. Seeing totality with my own eyes meant giving up on my photographic goal. I don't regret that for a minute but I was thrilled that this time the skies cleared for us just in time for the "Big Show".
To avoid having to split my attention between experiencing totality and taking pictures, I used our old 2012 MacBook Pro running a software package called Solar Eclipse Maestro to control the camera, snapping pictures at pre-defined times and exposure settings. SEM worked flawlessly and had it not been for a user-error on my part (which I'll cover in a future post), I would have captured everything I planned for. As it is, I still was able to capture most of what I planned including:
Diamond Ring effect (though not as spectacular as that from other people due to my snafu)
Although the images captured were as good or better than I hoped, post-processing them to fully bring out the available detail is a rather complicated thing involving a variety of software tools. I am still working on that but I wanted to go ahead and share some initial edits.
The image above is a blend of each of the 19 different shutter speeds used to capture images to submit to the Eclipse Megamovie project. They were taken during totality to capture as much fine detail of the solar corona as possible. The project team will use the calibration frames to pull out even more detail than appears in this image but, for my first pass at this I used some basic stacking techniques in Photoshop. Click on it to see enlarged... isn't the level of detail incredible?
I'm also including some cursory edits I've done of a few other images below including a partial phase image and a picture of Baily's Beads. What I am the most excited about though is the spectacular solar prominences that appear in the Baily's Beads shot. Wow! Even more incredible is that the largest one was visible naked-eye.
Once I've had time to go through the rest of my images and finish some of the more complicated editing processes, I'll share more of these. I'll also do a follow-up post on my equipment and what went into capturing these images.
I hope you got a chance to see totality for yourself but, if not, please enjoy my first pass at sharing the view with you.
Late in the partial phase of the eclipse. Note the sunspot in the center!
UPDATE: Now that I've had time to work on some of my other images and videos, I went back and remixed this one to fix some things I rushed the first time around. In this edit the sky appears darker, closer to what we saw that day, so the coronal ring around the Sun stands out better.
Another total solar eclipse imaging projects I planned to do is a timelapse sequence of the eclipse. In 2017 I tried shooting the entire eclipse but this time I just focused on the 5 minutes before totality, the 4+ minutes of totality and the 5 minutes after. Unlike 2017, we had much clearer skies and this came out pretty much just as I planned. Thanks to Alan Dyer (amazingsky.net) for the tips in his book on shooting the eclipse, specifically the tips on shooting a wide-angle timelapse!
To capture this, I set up my son Brian's Nikon D750 with our Irix 15mm f/2.4 wide-angle lens on a tripod at the corner of my son Chris' yard where we were observing the eclipse. My D750 was in use on the telescope so a big thanks to Brian for the use of his camera!
The sequence was shot with the internal intervalometer set to capture an image every second for 15 minutes with the timer set to start it at 1:35pm so that I didn't have to remember to start it on time. I set exposure ramping on so the camera would automatically adjust the exposure as the sky got darker and brighter, then set the exposure compensation to +1.33 so that it wouldn't be heavily overexposed during the pre- and post-totality shots.
Once at home, I processed the 900 images in LRTimeLapse and Lightroom Classic to create a video clip from the images and then added titles, adjusted track speed and added music in DaVinci Resolve. This is the finished product!
A few things to watch for in the video:
At about the 18 second mark, look for the small star to lower right of the Sun. That's not a star, it is the planet Venus!
The contrail at lower center is probably a commercial aircraft, possibly one of the one flying along the eclipse path to prolong how long they could watch totality.
At about the 36 second mark, the "insect" flittering about above us in the drone landing after shooting the arrival and departure of the lunar umbra.
As I shared in an earlier post, one of the many projects I planned for the total solar eclipse involved doing data collection with a variety of sensors based on ESP32 microcontrollers. I haven't done any detailed analysis of the results yet but based on a quick review of some of the sensor data there are clear changes that are in line with what I expected.
First up is the ambient air temperature measured with a BME280 sensor for temperature, relative humidity and air pressure.
The air temperature certainly dropped which makes sense given the gradual and then sudden drop in UV sunlight. Interestingly, the drop lagged the eclipse by about 15 minutes with totality starting at 1:40pm local time and the lowest temperature being reached at about 1:55pm. The higher temperature in towards the end of the eclipse makes a little sense given before totality had been mostly cloudy and after totality was mostly clear. I am not yet sure what explains the dip at 2:55 or the temperature reaching over 110 at the end of the eclipse. It wasn't that hot where we were so I have some research to do.
For air pressure, it appears there was a general trend down. Obviously, air pressure changes are related to broader atmospheric conditions. I suspect I needed to have data from a much longer period before and after the eclipse to have any chance of seeing any form of correlation.
As relative humidity generally has an inverse relationship to temperature (though it can be influenced by other factors), these results are what I would have expected.
Next up is light level measurements. I used two sensors, an AS7341 color spectrum sensor and a TSL2591, a light level sensor. The AS7341 data will take more analysis to make sense of though it does show light levels in all frequencies it measures dropped to nearly zero during totality. The light levels in lux from the TSL2591 are pretty easy to understand.
This completely aligns with totality which in the location in Ellis County, Texas, where we were started at 1:40pm and ended 4 minutes 16 seconds later. The left side of the graph makes sense as it was mostly overcast with the Sun occasionally poking through in the period prior to totality, hence the graph peaks and valleys before 1:40pm. The right side of the graph also makes sense. It was generally clear for about an hour after totality but with it turning partly cloudy again in the last half hour. Unlike the start of the eclipse, it was mostly clear skies with large clouds blocking the sun here and there.
Although this is all very preliminary, just taking a glance at data results via the Home Assistant UI, these seem very much in line with changes expected during a total solar eclipse. If I find other meaningful results as I get time to do a more detailed analysis, particularly the sound level data and the color spectrum data, I'll post that, too. \
Click on a graph to see them enlarged.
PS. As I expected, the magnetometer data collected with a QMC5883L doesn't appear to show any magnetic field changes that might correlate to the eclipse. I'll leave that science to the professionals!












 The journey continues beyond 2009... check it out!


