![]() |
| Copyright Nicolas Lefaudeux |
![]() |
| Capturing fine detail in the corona and the lunar surface illuminated by Earthshine |
![]() |
| Baily's Beads and Solar Prominences |
Reflections on sailing, astronomy and photography.
![]() |
| Copyright Nicolas Lefaudeux |
![]() |
| Capturing fine detail in the corona and the lunar surface illuminated by Earthshine |
![]() |
| Baily's Beads and Solar Prominences |
![]() |
| Click to enlarge |
Some news headlines leading up to the total solar eclipse last week suggested we might be able to see the "Devil Comet" (12P/Pons-Brooks) during totality, though with binoculars or a telescope, not naked-eye. We didn't see it but then we even forgot to use our binoculars to look at the eclipsed sun during totality much less remembered to use them to look for the comet.
I was asked whether the comet might appear in the photos I was taking with my telescope and my answer was, unfortunately no, it was well outside the field of view of my equipment.
However, I was excited to see an article in my news feed late last night describing a comet passing close enough to the sun to fit in a telescopic field of view. Called SOHO-5008, it was a sungrazer, a comet passing so close to the Sun it would appear in coronagraph images by the SOHO solar satellite. This one had been identified in SOHO images the morning of the eclipse and several people found that they had captured it in their eclipse images. Later that day, it had burned up in the Sun.
This morning, I pulled up my own images from totality and found that I had captured it, too! It took bumping up the exposure far more than I usually would but, once I did that and made a few other adjustments to bring out more detail, there it was. Here is an edit with labels similar to an image from my last post, noting some of the brighter stars visible from constellation Pisces and adding an enlarged inset for the comet.
I may do another edit later on to balance out the overall image but i wanted to go ahead and share this now.
Pretty cool, huh?
I went down a bit of a rabbit hole this week, assuming that to really get sharp detailed images of totality I needed to go through the rather involved process of using calibration frames to process all of the images I planned to stack before trying to stack, register and merge them. After spending a few evenings starting down that road, I took a break and in reviewing tutorials on processing solar eclipse images I ran across several that describe doing everything directly in Photoshop without the use of registration frames.
Following the process described in this Sky & Telescope article, I created the image above using a set of images shot at 2 stop intervals from 1/4000th of a second to 1 second, all shot at f/5 and ISO 100 with my Nikon D750 through our Sky Watcher Evostar 72ED telescope.
Click on it to enlarge and check out the incredible detail. You'll find features like:
This is just the first phase of edits described in the article so more to come. In the meantime, I did a separate version with features labeled.
As I shared in an earlier post, one of the many projects I planned for the total solar eclipse involved doing data collection with a variety of sensors based on ESP32 microcontrollers. I haven't done any detailed analysis of the results yet but based on a quick review of some of the sensor data there are clear changes that are in line with what I expected.
First up is the ambient air temperature measured with a BME280 sensor for temperature, relative humidity and air pressure.
The air temperature certainly dropped which makes sense given the gradual and then sudden drop in UV sunlight. Interestingly, the drop lagged the eclipse by about 15 minutes with totality starting at 1:40pm local time and the lowest temperature being reached at about 1:55pm. The higher temperature in towards the end of the eclipse makes a little sense given before totality had been mostly cloudy and after totality was mostly clear. I am not yet sure what explains the dip at 2:55 or the temperature reaching over 110 at the end of the eclipse. It wasn't that hot where we were so I have some research to do.
For air pressure, it appears there was a general trend down. Obviously, air pressure changes are related to broader atmospheric conditions. I suspect I needed to have data from a much longer period before and after the eclipse to have any chance of seeing any form of correlation.
As relative humidity generally has an inverse relationship to temperature (though it can be influenced by other factors), these results are what I would have expected.
Next up is light level measurements. I used two sensors, an AS7341 color spectrum sensor and a TSL2591, a light level sensor. The AS7341 data will take more analysis to make sense of though it does show light levels in all frequencies it measures dropped to nearly zero during totality. The light levels in lux from the TSL2591 are pretty easy to understand.
This completely aligns with totality which in the location in Ellis County, Texas, where we were started at 1:40pm and ended 4 minutes 16 seconds later. The left side of the graph makes sense as it was mostly overcast with the Sun occasionally poking through in the period prior to totality, hence the graph peaks and valleys before 1:40pm. The right side of the graph also makes sense. It was generally clear for about an hour after totality but with it turning partly cloudy again in the last half hour. Unlike the start of the eclipse, it was mostly clear skies with large clouds blocking the sun here and there.
Although this is all very preliminary, just taking a glance at data results via the Home Assistant UI, these seem very much in line with changes expected during a total solar eclipse. If I find other meaningful results as I get time to do a more detailed analysis, particularly the sound level data and the color spectrum data, I'll post that, too. \
Click on a graph to see them enlarged.
PS.
As I expected, the magnetometer data collected with a QMC5883L doesn't appear to show any magnetic field changes that might correlate to the eclipse. I'll leave that science to the professionals!
First of all, if you've been watching the weather forecasts, you may have concluded that the total solar eclipse passing through Dallas on Monday will be a bust. Well, don't give up hope, yet. Even though we got clouded out in 2017 on our trip to Marshall, Missouri, as you would see in my post from back then, I still managed to capture of view of totality through the clouds. All it takes is for the clouds to part a bit at just the right time or the clouds to be high altitude and thin for us to still be able to see totality. Regardless of the forecast, be sure to get outside to see what there is to see!
Even if we are clouded out, you'll still experience one aspect of a total solar eclipse: it will get dark! With that in mind, I expect to have a successful day whether I get to see the total eclipse or not. I have a bunch of microcontrollers (ESP32) with sensors that I'll be using to collect data that day.
That said, you may find that my approach to data collection is a bit unorthodox. Here's part of my setup for data collection. Yes, that is a Nonni's biscotti box. :-DSeriously, here's the type of data I'll be collecting:
The architecture I'm using builds on infrastructure I already have in place. I use Home Assistant running on a Raspberry Pi for my home automation, control and historical data. Home Assistant supports integrating data sensors using microcontrollers called an ESP32 via a system called ESPHOME. By attaching various sensor components to an ESP32 then configuring it in ESPHOME, it makes it simple to automatically collect sensor data in Home Assistant for storage, retrieval, monitoring and analysis.
Here is an example of a historical data graph in Home Assistant. The beauty of this besides being able to quickly visualize data is that Home Assistant also makes it easy to download the data for analysis in other tools.My original plan was to set things up to collect data through three full days, the day before, of and after the eclipse. Given the prospect of clouds and, more importantly, the forecast for rain on Tuesday, I've scaled back to just trying to collect data in the hours around the eclipse. I considered creating weatherproof enclosures for the sensors but that would have turned a shoestring-budget project into something quite a bit more expensive.
After things have wrapped up, I'll pull up history for all the sensor devices in Home Assistant and download the data for further analysis.
As for the details of the sensors I'm planning to deploy, let's start with the light sensors. You can see details of the code plus the specific sensors in this gist on github.com. For this sensor package, the ESP32 and the sensors are mounted on a breadboard that is in the bottom of the biscotti box.
The reason is that my goal is to measure changes in ambient light. For various (and technical) reasons, direct sunlight would be more challenging to measure with these sensors. Given we should see a drop in ambient light levels (and color levels) during totality even if it is cloudy, I think the data will be more predictable and meaningful just measuring ambient light. Pointing the sensors straight up and blocking them from direct sunlight should accomplish this.One thing you'll see in the ESPHOME code for each sensor package is that they generally report data back to Home Assistant once a minute but include a switch I can turn on that tells the sensor to send measurements every second (or faster). I have Home Assistant automations set up to flip the high speed data collection switch on for each sensor package a little while before the eclipse starts and turn it back off a little while after the eclipse ends. That way once I set things up Sunday evening or Monday morning, I can focus my attention on the eclipse, leaving the data collection to happen automatically.
On one side of the outside of the box is another ESP32 mounted on a breadboard with a sensor to measure the environment. Here's the gist with the ESPHOME including details on the sensor. It will collect data on temperature, relative humidity and air pressure. The code also derives absolute humidity and dew point.
Based on things I have read including published eclipse science projects, we should certainly see a change in temperature as the Moon's umbra passes over us during totality. Relative humidity has an inverse correlation to temperature so I expect to see changes to it that are similar to the temperature changes (but inverted). I have no idea what to expect in terms of changes in absolute humidity, air pressure and dew point but it will be interesting to see if there are changes that match the timing of the eclipse.
On the other side of the box is an ESP32 with a digital microphone. This one is set up to measure changes in sound levels throughout the eclipse. You'll see in the gist, this is based on a custom ESPHOME component. It provides sound levels in several forms but my interest is in just having the unfiltered (raw) sound levels.
Measuring changes in sound levels that can correlate to the total phase of the eclipse may be challenging. Although it may "get quiet" in terms of reactions to the darkness by birds and insects, my guess is that loud expressions of joy during totality by folks gathered with us to observe the eclipse may offset any drop in sound levels by nature.The last sensor package I've put together was an afterthought. I had one more ESP32 and also had a sensor that is a magnetometer, one that measures changes in magnetic fields in 3 axis. See this gist for the ESPHOME code which includes details of the sensor. The ESP32 I'm using in this case also happens to be much smaller than the others which seemed like to a good idea for a sensor trying to measure changes in local magnetic fields.
Based on my research, there have been changes in magnetic fields around Earth measured during past total eclipses but those measurements were performed with sophisticated equipment in the upper reaches of the atmosphere or in space. I don't have any reason to expect that I'll measure any changes that correlate to the timing of the eclipse with my simple magnetometer setup but I figure I'll do the data collection and see what happens.
For this sensor package, I've mounted the sensor on top of a wooden yardstick with the ESP32 below and a Wi-Fi antenna below that. My plan is to have this mounted on a stake well away from structures and people to minimize other magnetic fields nearby. However, that means it's further to the Wi-Fi router, hence the extra antenna. I'm also using a power pack instead of using a power adapter plugged into AC power. This means the only limitation on where I can put this will be how far from the house I get before the Wi-Fi signal drops.As I mentioned in my last post, I have a lot of irons in the fire for the April 8th 2024 total solar eclipse! One of those is all about viewing the overall eclipse: building a "Solar Funnel" or "Sun Funnel".
Our old telescope, a Parks 60mm refractor we bought about 30 years ago, happens to be on an equatorial mount and has a sidereal motor. All that means is that I can point it at something in the sky and the motor ensures that the object remains in the eyepiece (with only an occasional need to adjust the direction the telescope is aimed).![]() |
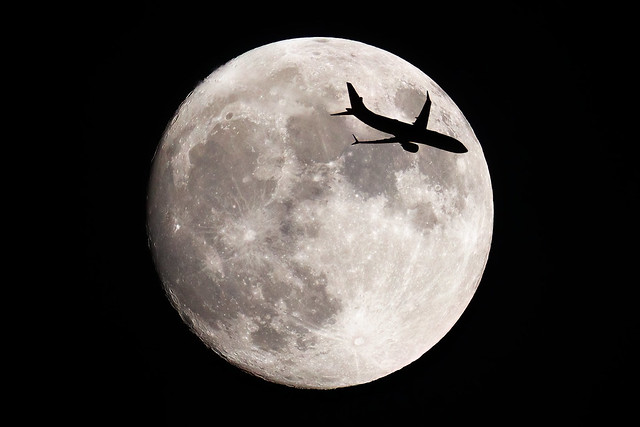
| Brandon Ghany on Flickr |
After my last post about capturing a jet flying in front of the Sun, I saw this image Brandon Ghany posted on Flickr of a jet crossing in front of the Moon and what caught my attention is how much smaller the jet is than in my video.
![]() |
| www.eclipse-chasers.com |
![]() |
| About 6 minutes before end of eclipse (C4), one sunspot group. |
![]() |
| Less than a minute left before C4, second set of sunspots now visible. |